Monday, May 30, 2011

Selling Short With Examples

Most investors make money by buying a security at a low price, then selling it later for a higher price. Owning a security is having a long position in that security. Selling short is a way to profit when the securities decline in price, by borrowing the securities, selling it, then hoping to be able to buy it back later at a lower price to replace the securities borrowed. However, if the securities pay a dividend or interest before the short is covered, then the short seller must pay those amounts to the lender of the securities.

In order to borrow the securities to sell short, the broker may lend out securities from the brokerage's own inventory, or from that of another brokerage, or he may lend out securities held in the margin accounts of other investors. If the broker is unable to borrow the securities, as sometimes happens with illiquid securities, for instance, then the security cannot be sold short.

A broker can lend out securities from the margin accounts of other investors, because the standard margin agreement allows it. When an investor opens a margin account at a brokerage, any securities bought for the account are held in the street name, the name of the brokerage for the beneficial interest of the investor and as collateral for any borrowing. The standard margin agreement allows the broker to lend out the securities held in its margin accounts to short sellers, and to be able to sell short, the investor must have a margin account.

Example—Profits and Losses from Selling Short.

An investor borrows 100 shares of XYZ stock that is currently trading at $35 per share and pays a 4% dividend, and sells it. Assume that the stock paid a dividend of $1.40 per share before the short seller covered his short. This puts $3,500 in the short seller’s margin account. $140 will eventually be deducted to pay for the dividend. If the price subsequently declines to $30, the investor can buy it back for $3,000 to return the borrowed shares, thus covering his short position, and netting $500 - $140 = $360 from the trade. If, however, the price of GM stock rises to $40, then the short seller will have to buy back the stock for $4,000, resulting in a net loss of $500 + $140 = $640. Brokerage commissions must also be subtracted from any profit or added to any loss. Note that for the same price movement of the stock, the loss from an unfavorable move is much greater than the profit gained from a favorable move

Before 1998, many investors sold short stocks that they actually owned—selling short against the box—as a means to protect capital gains, or to convert a short-term gain into a long-term gain, which has a lower tax rate. However, this method has been rendered ineffective by the Taxpayer Relief Act of 1997. Any short sale against the box after June 8, 1997, is considered a constructive sale by the IRS, and is subject to a capital gains tax in the year of the sale.

A large investor may also sell short against the box to prevent the disclosure of ownership in the security.

Friday, May 27, 2011

Margin Effects on Return On Investment - ROI

Margin increases the rate of return on investment, if the investment is profitable, but increases losses, if not. Furthermore, transaction costs, margin interest, and any dividend payments for shorted stock subtract from profits but add to losses. Any dividends received from purchased stock will increase profits and reduce losses. For a purchase, the rate of return is determined by the following equation:

Long Rate of Return = (Stock Sale Price + Dividends Received - Stock Purchase Price - Margin Interest) / Amount Invested
For instance, if you purchased $10,000 worth of stock with cash and the stock rises to $12,000, then your return on investment is:

Rate of Return = ($12,000 + 0 - $10,000 - 0 ) / $10,000 = $2,000 / $10,000 = 20%

If instead of paying cash for the stock, you pay $5,000 cash and use $5,000 of margin, then your rate of return, ignoring margin interest to simplify things:

Rate of Return = $2,000 / $5,000 = 40%

As you can see, using the maximum amount of margin almost doubles your rate of return if the holding period is short enough to keep margin interest negligible. From this example, you can also clearly see that if the value of the stock decreased by $2,000 instead of rising, then there would be minus signs in front of the rates of return. Furthermore, margin interest increases potential losses and subtracts from potential profits. To illustrate, if your broker charges 6% annual margin interest and you hold the stock for 1 year, then your broker will charge $300 of interest for the $5,000 you borrowed for 1 year. Thus, the rate of return if stock is sold for $12,000 is:

Rate of Return = ($12,000 - $10,000 - $300) / $5,000 = $1,700 / $5,000 = 34%

If the stock is sold at a loss for $8,000:

Rate of Return = ($8,000 - $10,000 - $300) / $5,000 = -$2,300 / $5,000 = -46%.

The longer the margin is borrowed, the more margin interest will decrease any potential profits and increase potential losses.

Note that the equation for shorted stock would be slightly different, since, as a short seller, you must pay any dividends to the lender of the stock that the lender would have otherwise received, but you do not have to pay margin interest. Thus, the equation for the rate of return for the short seller is:

Short Rate of Return =        Stock Sale Price - Dividends Paid - Stock Purchase Price
───────────────────────────────────────
                               Amount Invested

Monday, May 23, 2011

Here is How to Calculate Margin When Trade in Stocks and Futures

In a long transaction, you borrow money to buy securities, which you are obligated to pay back. Similarly, in a short sale, you sell securities short by borrowing the securities from a broker, then selling them, with the proceeds deposited in your account. But eventually you’ll have to buy the securities back to return them to the lending broker, which is why the market value of the shorted securities is considered to be a debit to your account.

Equity is equal to the total value of cash and securities if all open positions are closed and all financial obligations are satisfied. So if you deposit $5,000 in an account, and borrow $5,000 to buy $10,000 worth of stock, then your equity is initially $5,000 minus transaction costs. Accruing margin interest will also decrease your equity. If the value of the stock declines to $8,000, then your equity is reduced to $3,000 minus costs, because now the stock is worth $8,000, but you are still obligated to pay your broker $5,000 plus interest for the loan, which is your debit balance. Hence, when using margin to borrow money to enter into a long position by buying stocks:

Equity = Account Value – Debit Balance

Long Margin  = Equity
─────────────
Value of Securities

When margin is used as a performance bond to short securities, then equity equals the amount on deposit minus the value of the shorted securities.

So if you sold short $10,000 worth of stock instead of buying stock with your deposit, then your equity will equal the $15,000 on deposit ($5,000 deposit + $10,000 from short sale) minus the value of the shorted security, which is initially the $10,000 that you sold it for. If the value of the stock rises to $12,000, then your equity is reduced by $2,000, because you’re obligated to buy the stock back, so if you closed your position right now, you would pay $12,000 to buy the stock back and have $3,000 left in your account (minus transaction costs and dividend payouts). Since shorted securities have to be bought back, the debit balance is equal to the current market value of the shorted securities.

Equity = Account Value – Value of Shorted Securities

Note that the account value will be decreased by transaction costs and by any dividends that have to be paid out while the stock is borrowed.
Example — Calculating the Equity of a Short Account
If you deposit $5,000 and sell 1,000 shares of XYZ stock short for $10 per share, then there is $15,000 on deposit in your account, but your equity is still $15,000 - $10,000 = $5,000, which is, of course, what you initially deposited.

If XYZ price rises to $12 per share, then your equity = $15,000 - $12,000 = $3,000.

If XYZ price drops to $8 per share, then your equity = $15,000 - $8,000 = $7,000.
Short Margin  = Equity
────────────────────
Value of Shorted Securities

So the only difference in calculating the margin for a purchase and for a short sale is that the equity for a purchase is the account value minus the debit balance whereas for a short sale, the equity is the account value minus the value of the shorted securities. Both the debit balance and the value of the shorted securities are obligations that you eventually have to pay.
Example—Calculating the current margin and current equity of a short sale.
You open a margin account and deposit $5,000. You sell short 1,000 shares XYZ stock for $10 per share. The proceeds of the sale, $10,000, is deposited in your account for a total account value of $15,000.


Scenario 1 — The stock price declines to $6 per share, so the 1,000 shares that you sold short is currently worth $6,000. Thus:
  • your equity = $15,000 - $6,000 = $9,000
  • your margin = $9,000/$6,000 = 1.5 = 150%
Thus, this short sale would be profitable if you bought back the shares now to cover your short, for a net profit of $4,000 minus brokerage commissions and any dividends that had to be paid while the stock was borrowed.


Scenario 2 — The stock price rises to $12.00 per share, which means it will cost you $12,000 to buy back the shares now.
  • your equity = $15,000 - $12,000 = $3,000
  • your margin = $3,000/$12,000 = .25 = 25%
Because your current margin is now less than 30%, you will be subjected to a margin call. If you decide to buy back the shares now to cover your short, your net loss will be $2,000 plus brokerage commissions and any dividends that had to be paid while the stock was borrowed.
Remember that the above formulas and calculations have been simplified by excluding transaction costs, margin interest, and any dividends that have to be paid for shorted stock. These excluded factors reduce the equity in your account.

Thursday, May 19, 2011

Pyramid Into Positions

How do you decide when to pyramid your position? How much capital should I pyramid with? Pyramiding means adding equity to a position that is already trending in the expected direction and the method of pyramiding the same for trading short as for trading long

Once we have a position in play that has enabled us to move our stop from an initial stop to a breakeven stop and finally to a trailing stop we are faced with the issue of whether to add additional capital to a position.

You should never throw good money after bad by buying more of a share that is not trending according to your initial expectations. This is called 'averaging down'. By deciding to ignore your stop, and buy more of a down trending share, your average purchase price may be lower, but the amount of capital that you have in the trade would have increased. Following this strategy, you may be ultimately holding a large parcel of downtrending shares that are draining your trading equity. Often people follow this course of action in the doomed attempt to turn a losing trade into a winning one.

When to Pyramid

If you have moved your stop up to break even, and the share has continued to trend in the direction you were expecting, you could add money to your winning position. The way to do this is to set 'land-marks' which will help determine when this action is appropriate.

If you set your initial stop based on patterns, you could move your stops, or decide to pyramid based on an appropriate pattern appearing. If your initial stop was made due to a trigger by a specific indicator, if you get another signal from this indicator you could decide to move your stops, or pyramid.

Using ATR (Average True Range) to Pyramid

Let's say that you're already in a position, and you have chosen a 3 Average True Range exit from your entry as an initial stop, and the share trends in the expected direction. When the share has gone up 6 ATR from your initial stop, (ie 3 ATR from your initial entry) you could move your stop to breakeven. (ie the stop is still 3 ATR below the current share price action).

When the share has gone up an additional 3 ATR from where you had decided to move your stop to the breakeven point, you could consider adding more money to the position (i.e. 6 ATR from your initial point of entry, or 9 ATR from your initial stop).

So, when the share moves up 6 ATR from your entry, consider pyramiding your position, and move your stop to 3 ATR below the current share price. When the share moves up 9 ATR from your initial entry, add another pyramid tranche and remember to move your stop to 3 ATR below the current price.

Every time you pyramid, you should re-set your stop based on the most recent ATR calculation, at 3 ATR below your new entry point. This ensures that the stops act as a mechanical ratchet to protect capital.

Your stops for every position should move in tandem, so you will not end up with a series of different stops for each pyramid point. You will get a chance to practice this skill, as it is essential to conquer in order to ride a trend effectively. As a suggestion, use a 15 - 20 day ATR.

If you are more used to using 2 ATR as a stop, the principles described above stay the same, but use 2 ATR increments instead of 3 ATR.

Pyramid Position Sizes

The additional input of capital into a trade should occur with smaller increments of the initial amount. For example, if you position sized based on 1% risk, your subsequent pyramid amounts could be based on .5% risk and .25% risk.

As the name suggest pyramiding involves the addition of sequentially smaller amounts of capital to any given position. Note the situation for pyramiding into futures is distinctly different to pyramiding into shares because a futures contract only requires the addition of a small amount of capital. Effectively the position is margined to around 98% of its total value.

With pyramiding into shares we effectively run into a efficient threshold beyond which it is prudent to add more capital. According to various theorems this frontier lies between 20% to 25% of capital. I regard that as too high and prefer the limit to be around 15%.

To examine pyramiding consider the following hypothetical

Monday, May 16, 2011

Margin Trading and Pyramiding

The main reason to borrow money to buy securities is for financial leverage. Financial leverage can increase the rate of return for an investment, if it is profitable, but it also increases potential losses. Because of the potential for greater losses, traders become more emotional in their trading decisions, which may cause excessive trading, which increases transaction costs, and it may cause bad trades when emotion overrules reason. Furthermore, the longer the money is borrowed, the greater the amount of margin interest that must be paid, so using margin for buy-and-hold strategies is generally not a good idea.

Another major disadvantage to using margin is that the trader potentially loses some control over the account. If purchased stock drops too much, the broker has the right to sell the stock before notifying the customer. For a short sale, the broker may be forced to buy back the securities in an illiquid market, if the lender wants the securities back.

If the margin ratio increases because purchased securities have increased in value or because shorted securities have decreased in value, then the trader gains excess margin that can be used to purchase or short additional securities. Continually using excess margin to increase investments is called pyramiding

While pyramiding may work for a while, at some point, the equity of the account is going to decline, because stocks don’t continually increase in value nor do shorted stocks continually decline in value. Therefore, eventually there will be a margin call. Hence, the use of margin should be restricted to short-term trades.

Friday, May 13, 2011

Margin Agreement, Initial and Maintenance Margin, Margin Calls, and Restricted Accounts

The most general definition of margin, one that covers both buying and shorting securities, is the ratio of the equity of the account divided by the value of the securities. The equity of the account is simply what is left when the debit balance is paid in full or the shorted stocks have been bought back and returned to the lender.

If money is borrowed, then it must be paid back, so the amount borrowed plus the accrued margin interest is a debit to the account; if stocks are sold short, then the shorted stocks must be bought back, so the value of the shorted stocks are a debit to the account.

Margin  = Equity
─────────────
Value of Securities

To use margin for trading, you have to open a margin account by signing a margin agreement. The agreement stipulates, among other things, the initial margin requirement as a percentage, and the margin maintenance percentage. Any securities bought in a margin account are held in the broker’s street name, and the margin agreement usually gives the broker the right to lend the securities out for a short sale.

Margin trading is governed by the Federal Reserve, and other self-regulatory organizations (SROs), such as the New York Stock Exchange and the NASD. Regulation T, promulgated by the Federal Reserve, requires that the minimum deposit be $2,000, and that the initial margin percentage be at least 50%.

There is also a minimum maintenance margin requirement of 25%. The exchanges or the brokerages can set stricter requirements than those required by the Federal Reserve if they choose. At most brokerages, the maintenance margin requirement is set higher, usually at 30%.

The margin ratio cannot be less than the maintenance margin rate. If the margin ratio falls below 50%, but remains above the maintenance margin requirement, then the account will be restricted. No additional securities can be bought or sold short in a restricted account, unless the trader deposits additional cash or securities to increase the margin level to at least 50%.

The amount of margin available will depend on the price of the securities. If margin is used to buy securities, then the amount of margin increases with the market value of the securities, but if the margin is used to short securities, then the amount of margin is inversely related to the price of the shorted securities, and vice versa.

If the equity does drop below the maintenance margin requirement, then the broker will issue a margin call, requesting that additional cash or securities be deposited so that the margin ratio of the account is equal to at least 50%. If you do not respond to the margin call, then your broker will sell enough of your securities that were purchased on margin and/or buy back your shorted securities at the market to bring your margin ratio back to the initial margin requirement of 50%.

Tuesday, May 10, 2011

Margin in Stock and Futures Trading

Margin is the use of borrowed funds in brokerage accounts to buy securities using them as collateral. Like any loan, the borrower must pay interest while the loan is outstanding, and must eventually pay the loan back.

The interest on the borrowed funds—margin interest—is slightly higher than the prime rate that banks charge to their best customers. To use margin, the customer must open a margin account with a broker, and the money is borrowed from the broker. The interest rate charged by the broker will depend on how much the broker pays its bank for the money—called the brokers rate—plus whatever amount the broker decides to add. Typically, brokers have a sliding scale of margin interest that depends on the size of the individual trading account, with larger accounts paying a lower interest rate than smaller accounts.

Margin can also refer to the minimum amount of equity required to insure the performance of an obligation. A common example is the margin needed to short stocks. To sell a stock short, you borrow the shares from a broker, then sell them in the market, with the hope of being able to buy the shares back at a lower price. The proceeds of the stock sale are placed in your brokerage account. Although you are not buying the stocks initially, you will still be required to have a minimum amount of equity in your account before you can short the stock to guarantee that you will be able to buy them back later, even if the price of the stock is higher than the shorted price. You do not have to pay interest nor do you earn any interest on the sale proceeds, because the money is not yours, but is held as security to buy the stock back later.

Similar to the margin requirement to short stocks, the term margin is also used in futures and forex accounts that specify the amount of cash or cash equivalents, such as U.S. Treasuries, that are required to guarantee the performance of the futures or currency contract. In futures, the margin requirement is frequently referred to as a performance bond, because it is not borrowed money, but is a deposit that guarantees the performance of the contract at the time of settlement. A trader pays no interest on the margin in a futures or forex account—in fact, traders can earn interest by depositing U.S. Treasuries in a futures account to cover the margin requirement.

In futures and forex, the margin requirement is often expressed as a leverage ratio, which is inversely related to the margin percentage:

Margin Percentage = 100
───────────
Leverage Ratio
Example — Calculating the Margin Percentage from the Leverage Ratio
A 100:1 leverage ratio yields a margin percentage of 100/100 = 1%. A 200:1 ratio yields 100/200 = 0.5%. You'll often see these leverage ratios advertised by forex brokers. A 100:1 ratio allows you to buy $100,000 worth of currency while posting only a mere $1,000! Forex brokers can offer these low margin requirements because currency doesn't move with the same magnitude as stocks, especially in a short time, but the large leverage ratio does make currency trading very risky if all of the margin is used.


Leverage Ratio = 1/Margin Percentage = 100/Margin Percentage
Example — Calculating the Leverage Ratio from the Margin Percentage
Most stock brokers require at least a 50% initial margin, therefore:

Leverage Ratio = 1 / 0.5 = 2

In other words, you can buy twice as many stocks using maximum margin than you can without using margin. Your investment is leveraged for greater profits or greater losses.

Margin ratios are usually much smaller in futures than for stocks, where leverage ratios are typically 10:1, which is equal to a 10% initial margin requirement, but this varies depending on the underlying asset, and whether the trader is a hedger or a speculator—speculators have a slightly higher margin requirement. Forex accounts have an even lower margin requirement, which may vary, depending on the broker. Regular forex accounts typically allow 100:1 ratios, which corresponds to a 1% margin requirement, and the typical ratio for a forex mini-account is 200:1.

Monday, May 9, 2011

Types of Stocks - Large-Cap, Mid-Cap, and Small-Cap Stocks

Stocks are sometimes categorized by their market capitalization, or market cap.

Market Capitalization = Stock Price x Number of Stocks Outstanding

While the divisions are indistinct, and will depend on inflation, a large-cap company is one with a market cap greater than $5 billion; a mid-cap company , $1 - $5 billion, and small-cap companies are valued at less than $1 billion. Many of these companies can be found by looking at the components of the various indexes, such as the Russell Indexes.

The large-cap stocks consists of the blue-chip, income, defensive, and cyclical stocks, since large companies have little potential for growth. Capital gains can be earned, however, by buying these stocks at the bottom of a business cycle and selling them as the economy reaches full speed. Large-cap stocks have the best price stability and the least risk.

Mid-cap stocks are composed of most of the categories listed here, since their market caps range from the top of the small-cap market to the bottom of the large-cap market. A particular kind of mid-cap stock are the baby blue-chip stocks, which are stocks of companies that, like the blue-chip companies, have consistent profit growth and stability, and low levels of debt, but are smaller in size than the large-cap blue-chips.

Small-cap stocks are small companies that have the greatest potential for growth—hence, most of these stocks are growth or speculative stocks, and most tech stocks are also in this category, since many tech companies specialize in a narrow niche of the market, or they were started to develop a new product or service, such as the many Internet companies that sprouted during the stock market bubble. In some cases, the small-cap stocks are distinguished from the even smaller micro-cap stocks., such as can be found in the Russell Microcap Index. Note that even the micro-cap stocks include only those stocks that are listed on major exchanges—they do not include OTC bulletin board securities or pink sheet stocks, which do not satisfy the requirements to be listed on a major exchange.

Small-cap stocks tend to do better than other stocks at the beginning of an economic expansion, unless their growth is constrained by the availability of credit, since they rely more on banking financing than larger companies that can sell bonds directly to the market.

Saturday, May 7, 2011

EAST Trading System Performance (April 2011): +9.67%

EAST – Short Only

Direction: Short Only
Leverage Used: 2:1
Max Drawdawn: -4.25%
Starting Capital: $10,000
Ending Capital: $20,684
Net Profit (Month April): $1,823
Net Profit % (Month April): 9.67% 
Net Profit (Since Inception): $10,684
Net Profit % (Since Inception): 106.84%

The April was not like March. when system made 32.96%, still we are quite happy as system finished the month with a profit of 9.67%. Drawdown is increased to -4.25%, which in reality is even higher because not all trade are included in calculation of a drawdown. For more informations see last month prerformance. In April 2011 system made a profit of 9.67% with a -4.25% drawdown. 
The chart below shows daily profit and loss made during this month. As it can be seen from the chart, largest daily loss was -1.73% and largest daily gain was 3.23%.

To see East's last month report click here, and other trading systems offered click here. If You would like to subscribe to this system and start reciving daily Trade Alerts,  click on the link below and fill out the form:

SOUTH Trading System Performance (April 2011): +28.82%

SOUTH – Short Only

Direction: Long Only
Leverage Used: 2:1
Max Drawdown: -9.24%
Starting Capital: $10,000
Ending Capital: $31,354
Net Profit (Month April): $7,013
Net Profit % (Month April): 28.82% 
Net Profit (Since Inception): $21,354
Net Profit % (Since Inception): 213.54% 

April was another very good month for our system, posting an overall gain of 28.82%, after making 53.16% in March! Unlike last month when system started to make money from the first day, this time system lost money for the three consecutive days, and that resulted in a higher drawdown. After having a negative first week, system started to make profits and continued to do so until the end of a month with only one more negative day. Because of that negative first week, our drawdown based on loosing trades in April increased to -9.24%.

At the end of April, South trading system made 28.82% before commissions, and a compounded gains of 213.54% (since inception in January 2011). This month’s drawdown was -9.24%, which is higher then a historical drawdown of -5.37%. It is important to understand that reported drawdown was based on loosing trades only, which means that if a trade was profitable when closed, but had a loss while it was opened (because of natural contractions of the market), that loss would not be reported by our drawdown calculations! Real drawdown is allways higher by 3-5%, so readers should know this.
Largest daily loss during the month was -4.73%, and a largerst daily gain of 8.24%.
At the end of reporting month and since inception, South trading system made a profit of $21,354 and finished a month with a balance of $31,354.
To see South's last month report click here, and other trading systems offered click here. If You would like to subscribe to this system and start reciving daily Trade Alerts,  click on the link below and fill out the form:

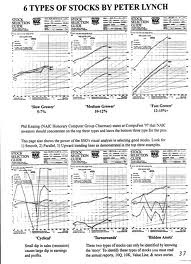
Types of Stocks

Investors have different objectives, such as growth or income, and different investment horizons. Hence, they seek out stocks that have the qualities that they look for. To satisfy this need, stocks have been categorized according to their investment characteristics. The most common categories are listed below.

Blue-Chip Stocks

Blue-chip stocks are stocks of large, stable companies that have a long history of stable earnings and dividends, and are typified by the stocks composing the Dow Jones Industrial Average, including General Electric, IBM, Microsoft, and Pfizer. Because of their large size, there is virtually no potential for a high growth rate, so most of the return of these stocks is in the form of dividends. However, capital gains can be earned from these stocks if they are bought in a bear market, when stock prices are depressed overall. For instance, during the credit crisis of November and December, 2008, and the early part of 2009, Microsoft was trading below $20 per share, whereas before this, Microsoft had been trading at around $30 per share for a long time. It's reasonable to assume, given Microsoft's strong financial position, that its stock price will return to $30 a share, and, perhaps, surpass it.

Income Stocks

Income stocks generate most of their returns in dividends, and the dividends—unlike the dividends of preferred stock or the interest payments of bonds—will, in many cases, grow continuously year after year as the companies' earnings grow. These companies have a high dividend payout ratio because there are few opportunities to invest the money in the business that would yield a higher return on stockholders' equity. Hence, many of the these companies are already very large, and are also considered to be blue-chip companies, such as General Electric.

Cyclical Stocks

Cyclical stocks cycle with the economic cycles, going up strongly when the economy is growing and declining as the economy declines. Most of these companies supply capital equipment for businesses or big ticket items, such as cars and houses, for consumers. Some examples include Alcoa, Caterpillar, and Brunswick. The best time to buy these stocks is at the bottom of a business cycle, then sell when the cycle peeks.

Defensive Stocks

Defensive stocks are issued by companies that are resistant to the economic cycles, and may even profit from them. When consumers and businesses cut back spending, a few other businesses profit, either because they offer a way to cut costs, or because they have the lowest prices. For instance, during the credit crisis of late 2008 and early 2009, people tried to save by doing more for themselves. For instance, many people starting cutting hair for their families, or coloring their own hair to save the $200 that some beauty shops charge. This increased business for businesses that manufactured hair cutters and coloring kits. Auto repair shops tend to do better, because people cut back on the purchase of new cars, but cars nowadays are too complex for most people to fix on their own. And while most retailers were hurting significantly during the credit crisis, Wal-Mart was one of the few that actually thrived, since Wal-Mart is usually recognized as providing lower prices than other retailers.

Growth Stocks

Growth stocks are stocks of companies that reinvest most of their earnings into their businesses, because it can yield a higher return on stockholders' equity, and ultimately, a higher return to stockholders, in the form of capital gains, than if the money were paid out as dividends. Typically, these companies have high P/E ratios because investors expect high growth rates for the near future. Note, however, that growth stocks are risky. If a growth-oriented company doesn't grow as fast as anticipated, then its price will drop as investors lower its future prospects with the result that the P/E ratio declines. So even if earnings remain stable, the stock price will decline.
Another risk is bear markets—growth stocks will tend to decline much more than blue-chips or income stocks in a declining market, because investors become pessimistic, and will sell their stocks, especially those that pay no dividends.
One of the main benefits of growth stocks is that capital gains, especially long-term gains where the stock is held for at least 1 year, are generally taxed at a lower rate than dividends, which are taxed as ordinary income.

Tech Stocks

Tech stocks are the stocks of technology companies, which make computer equipment, communication devices, and other technological devices. Most tech stocks are listed on NASDAQ. The stocks of most tech companies are either considered growth stock or speculative stock; some are considered blue-chip, such as Intel or Microsoft. However, there is considerable risk in tech companies because research and development efforts are hard to evaluate, and since technology is continually evolving, it can quickly change the fortunes of many companies, especially when old products are displaced by new products.

Speculative Stocks

Speculative stocks are the stocks of companies that have little or no earnings, or widely varying earnings, but hold great potential for appreciation because they are tapping into a new market, are operating under new management, or are developing a potentially very lucrative product that could cause the stock price to zoom upward if the company is successful. Many Internet companies were considered speculative investments. During the stock market bubble of the latter half of the 1990's, many of these stocks had ridiculous market capitalizations, and yet, many of them had virtually no earnings, and many, if not most, have since then, imploded. A few, such as Amazon, have grown to become major corporations.
Many speculative stocks are traded frequently by investors—or some would say, gamblers—in the hope of making a profit by timing the market, since speculative stocks range wildly in price as their perceived prospects constantly change.

Wednesday, May 4, 2011

NORTH Trading System Performance (April 2011): -4.35%

NORTH – Long Only

Direction: Long Only
Leverage Used: 2:1
Max Drawdown: -10.75%
Starting Capital: $10,000
Ending Capital: $12,330
Net Profit (Month April): -$560
Net Profit % (Month April): -4.35% 
Net Profit (Since Inception): $2,330
Net Profit % (Since Inception): 23.30% 

April was a bad month posting an overall loss of -4.35%, after making 3.79% profits in March. From the first day in April, system started to loose money, and after making small recovery, it continued in loosing fashion until the end of the month.

At the end of April, North trading system lost -4.35%, before commissions and lowered it compounded gains to 23.30% since inception (January 2011). This month’s drawdown was -10.75%, highest since inception of the system.
Largest daily loss was -1.62% and largest daily gain was 0.88%.
At the end of this month, since inception, North trading system made $2,330 and finished a month with a balance of $12,330.
To see North's last month report click here, and other trading systems offered click here. If You would like to subscribe to this system and start reciving daily Trade Alerts,  click on the link below and fill out the form:

Tuesday, May 3, 2011

Dividend Payment - Cash and Stock Dividends

There are 2 common types of dividends. Cash dividends are dividends that are paid in cash, and are the most common type of dividend. Stock dividends are paid in extra shares of stock instead of cash. Sometimes, however, a company will distribute a different type of dividend, such as the stock of a spin-off company.

Whether the dividend is paid as cash or as stock, the payment of a dividend reduces the price per share of the company. If the dividend is paid as cash, then the company will have less cash, reducing its value, and, therefore, its value per share. If the dividend is paid as stock, then there are more shares outstanding, but the value of the company has not increased; therefore, the company’s value per share is reduced. For example, if a company pays a 10% stock dividend, then it will distribute 1 share of stock for every 10 shares that the holders of record own, and the total number of outstanding shares will also increase by 10%. However, the main advantage of a stock dividend for the company is that the retained earnings can all be reinvested for greater growth. The main advantage of a stock dividend for the stockholder is that no taxes have to be paid on the stock dividend until the shares are sold.

Taxation of Dividends

Dividends are subject to double taxation. The corporation must pay taxes on the income used to pay dividends and the shareholders must pay taxes on cash dividends. There is no tax due on stock dividends until they are sold.

Dividends were originally taxed as ordinary income, but the Jobs and Growth Tax Relief Reconciliation Act of 2003 lowered the tax to 5% for stockholders in the lowest 2 tax brackets and 15% for the higher tax brackets. However, it will probably be raised soon by the new Democratic administration.

Many large corporations provide dividend reinvestment plans (DRIPs) for their stock. These programs allow investors to buy company shares directly from the company, void of all brokerage commissions or the need to buy round lots, and the company will reinvest the dividend into additional company stock. In fact, dividends can be used to buy fractional shares of stock. Most companies also allow partial participation where the stockholder can specify the amount to be reinvested and the amount to be paid as cash. While DRIPs are excellent investment vehicles, they differ from stock dividends in that taxes are due on the reinvested dividends in the year that the dividends are earned.

Monday, May 2, 2011

How The Dividend Is Paid

When the board of directors declares a dividend, which is on the declaration date, they also specify the date of record and the payment date. The date of record is the date when a stockholder must be a registered owner of the stock—a holder of record—to receive the dividend. The payment date (aka payable date) is when payment is actually made—generally about 3 weeks after the date of record.

Because it takes 3 business days to settle a stock trade, the date of record determines the ex-dividend date, which is 3 business days earlier. The ex-dividend date is the 1st day in which the stock trades without the recently declared dividend. In newspaper listings, a stock is marked with an x to indicate that it is ex-dividend. An investor who buys the stock during the ex-dividend period will not be entitled to the recently declared dividend.

The price of the stock increases steadily by the amount of the dividend until the date of record, then drops by the same amount on the ex-dividend date. This happens because investors are willing to pay more if they are expecting to receive the dividend, which offsets the increased price. Moreover, open buy and stop sell orders are also usually reduced by the dividend amount on the ex-dividend date.

Dividend Yield and the Dividend Payout Ratio

Although the dollar amounts of dividends are specified by the board of directors, investors often want to know how the dividend compares with other investments. The dividend yield, which is the dollar amount of the dividend divided by the common share price, yields a percentage allowing the investor to compare the stock to other investments, especially if the investor is primarily concerned about current income.

Dividend Yield = Annual Dividends Per Share / Current Stock Price

Example: If a stock pays a $1 quarterly dividend and the current stock price is $60 per share, then:

Dividend Yield = $1 x 4 / $60 = $4 / $60 = 6.67%
Another concern of investors when considering a dividend-paying stock is whether the company can continue paying the dividend or even increase it over time. A company can only pay a dividend over an extended period of time if it is highly profitable. If a company is only minimally profitable, it will probably withhold the payment of dividends during economic downturns. And a company can only increase the dividend if its earnings grow. The dividend payout ratio, which is the dividend per share divided by the common earnings per share, is a good indicator of whether a company can continue to pay the dividend and even increase it in the future.

Dividend Payout Ratio = Dividend Per Share
─────────────────────
Common Earnings Per Share


For example, if a company earns $8 per share and pays $1 per share quarterly as a dividend, then its:

Dividend Payout Ratio = 1 x 4 / 8 = 4/8 = 50%.

If a company’s dividend payout ratio is greater than 60%, especially over a long time period, it will probably not increase its dividend for the foreseeable future, and it may have to lower it or even suspend it in hard economic times because most of its earnings are being paid out as dividends.